
Reporting
Analyze trends.
Act on opportunities.

Track your progress and align on goals with an intuitive reporting experience. Visual dashboards connect the big picture to the numbers behind it, helping you spot trends and make faster decisions that drive growth.
Visual dashboards
See your business
clearly, at every level
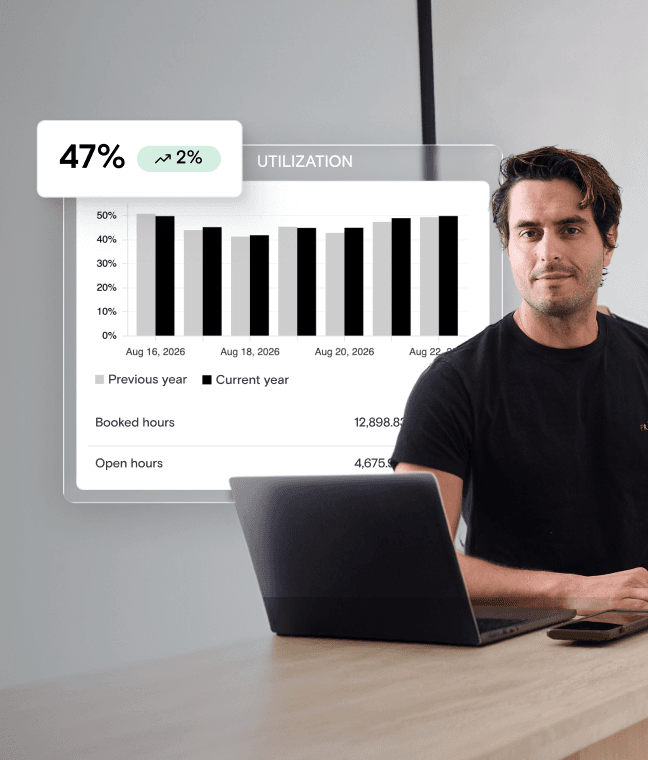
Data
Turn insights into
action
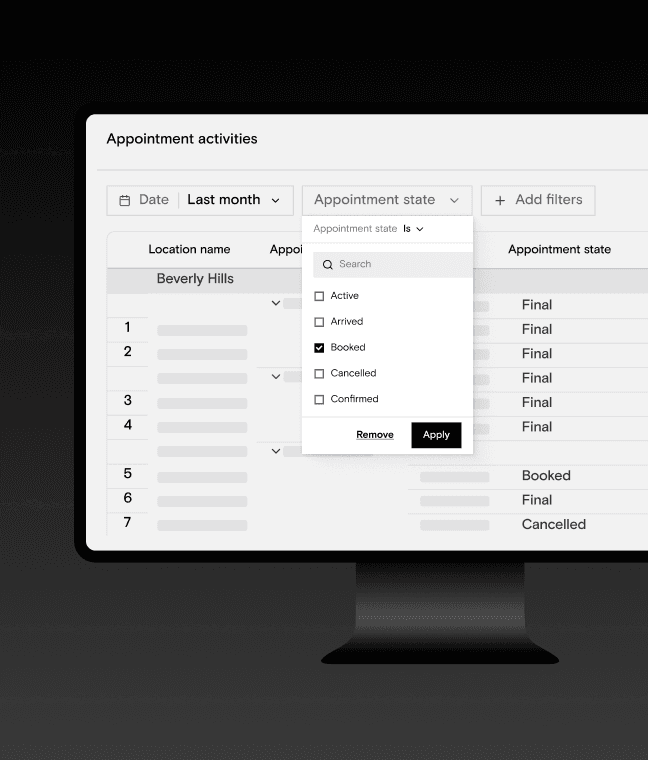
Exports & views
Flexible data
organization & sharing
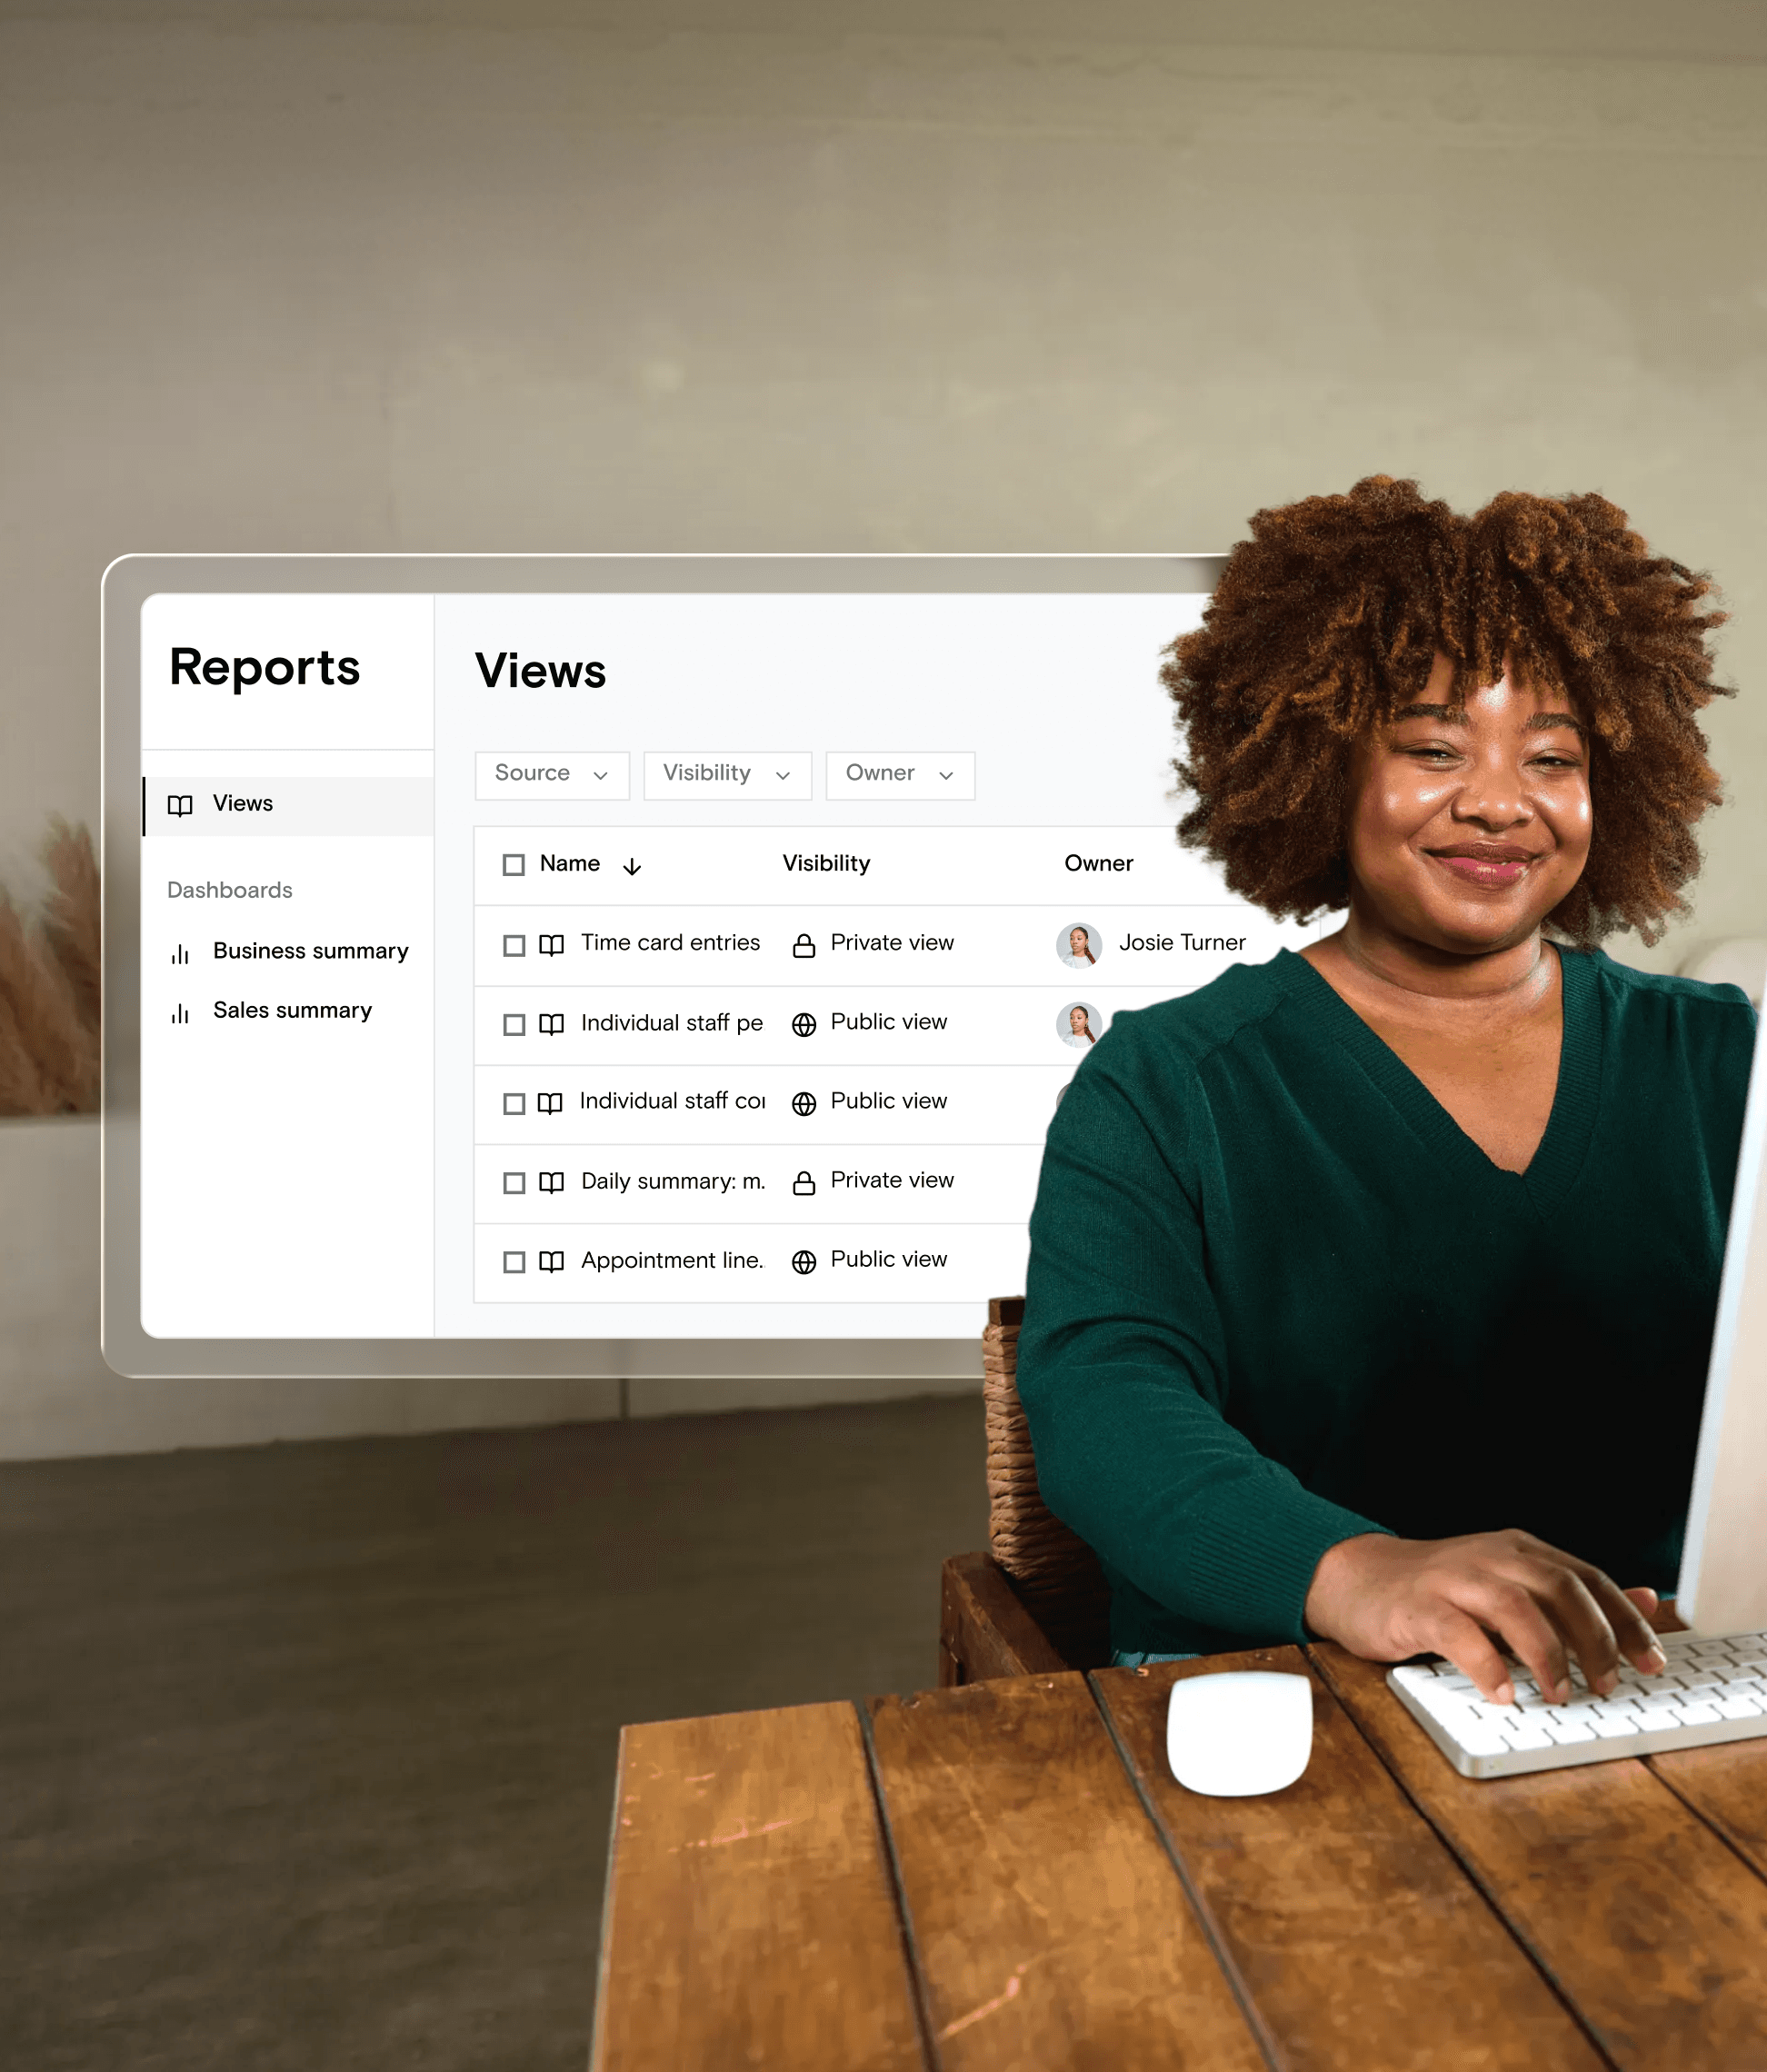
Scalable
For growing teams,
accuracy at scale
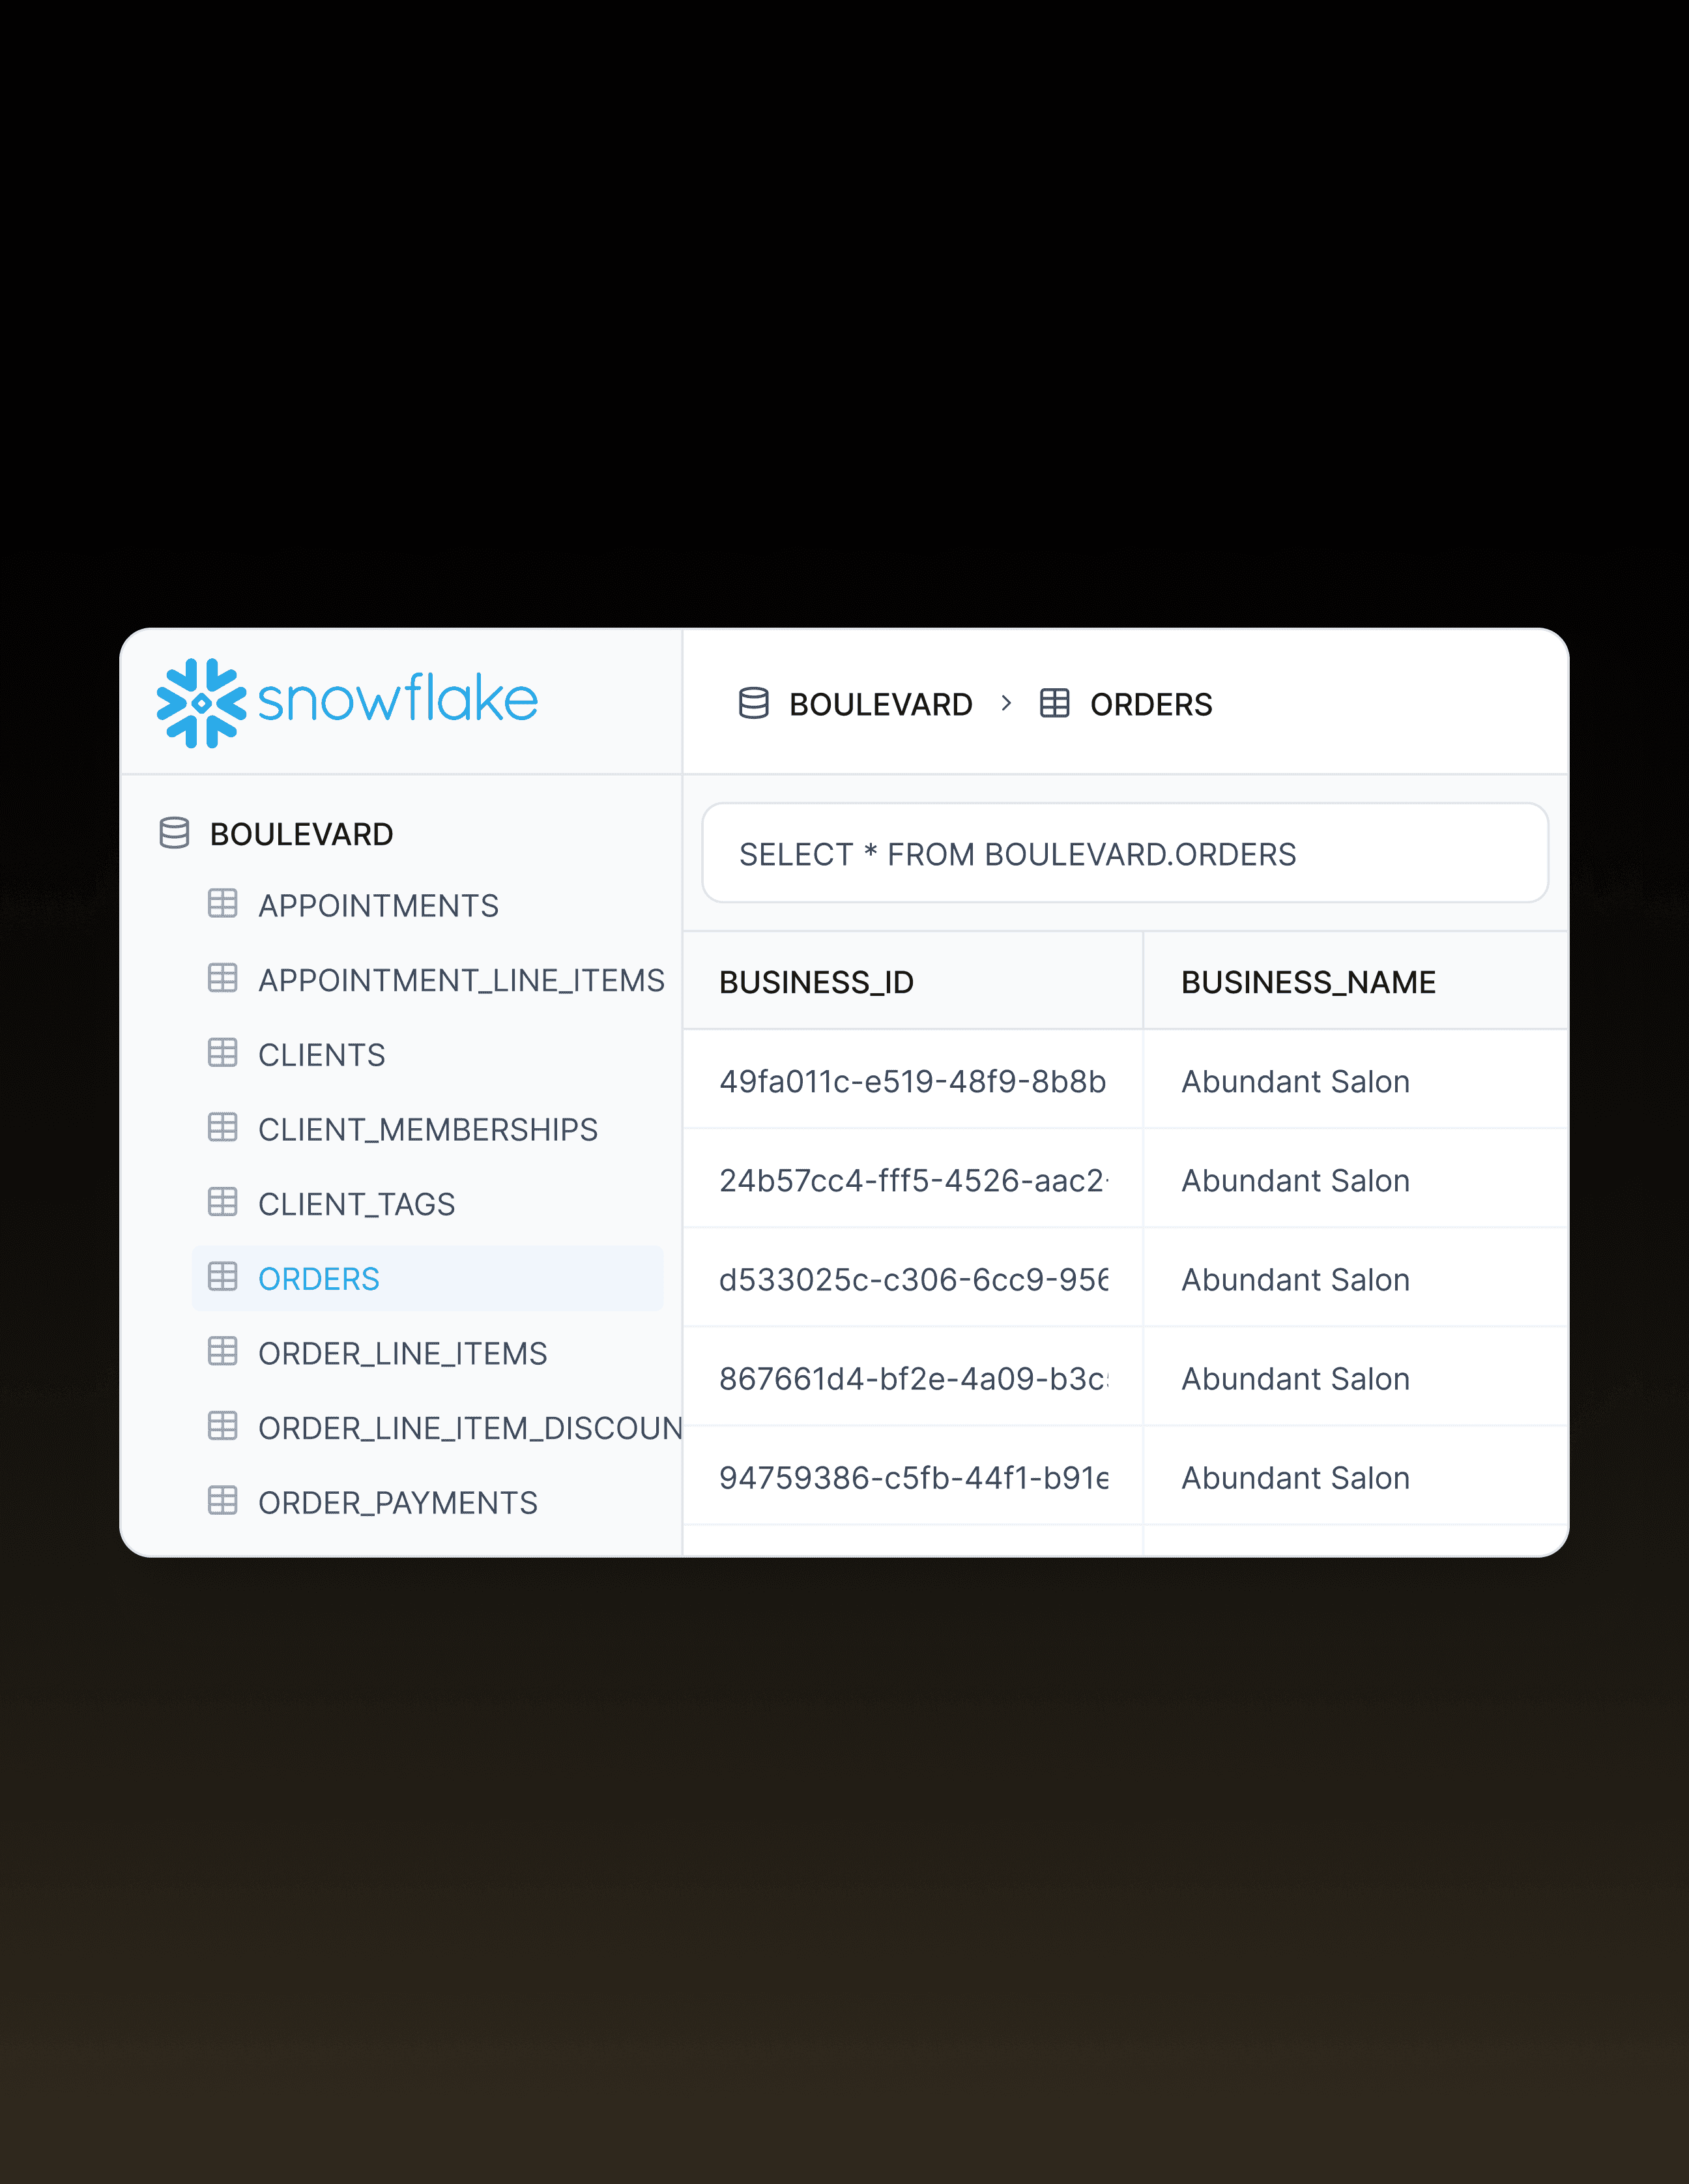

Transparency on your terms.
Granular permissions let you tailor reporting access by role and location so everyone stays focused on the numbers that drive their work.

Timely visibility where it matters.
Reports tied to sales activity and revenue refresh more frequently, giving you timely visibility into the metrics you rely on most throughout the day.

“I spent an hour and a half on reports last night and my head blew up, I was so impressed... Our guests are thrilled.”
Ian Palmiero, Owner, Scissor and Comb Salon

See why business is
better with Boulevard
Blog highlight
 Best Practice
Salon Reports: How to Use Data to Grow Your Revenue
Salon Reports: What They Are, Why They Matter, and How To Act on Them A salon report is a structured snapshot of your business performance t…
Read Article
See the Numbers: How Boulevard’s ROI Calculator Proves the Value of Switching
Calculate your business’s true potential with Boulevard’s free ROI Calculator Why ROI Matters in the Self-Care Industry Running a salon, spa…
Read Article Events
Revenue & Retention: KPIs That Keep Your Business Blooming
Track your client retention, operational efficiency, and revenue to drive sustainable growth for your self-care business Think of your self-…
Read ArticleSee Everything You Get. Then Decide.
No pressure. Just a clear look at what Boulevard can do for your business. See a live demo in under 30 minutes and try it out for yourself—no contract necessary.
Frequently Asked
Boulevard’s reporting tools give you visibility into the metrics that matter most to your business. From revenue and bookings to client retention and retail sales, you can monitor performance from high-level dashboards to detailed reports.
Boulevard helps you track key performance indicators across your business, including sales, appointments, client retention, memberships, gift cards, and team performance. This makes it easier to understand what’s driving growth and where there may be opportunities to improve.
Yes. Boulevard allows you to build custom report views tailored to your business by surfacing the metrics that matter most to you.
Boulevard reporting helps you understand what’s working across your business so you can make smarter decisions about staffing, client retention, marketing, and revenue growth. Better visibility leads to more strategic planning and smarter, more sustainable growth.